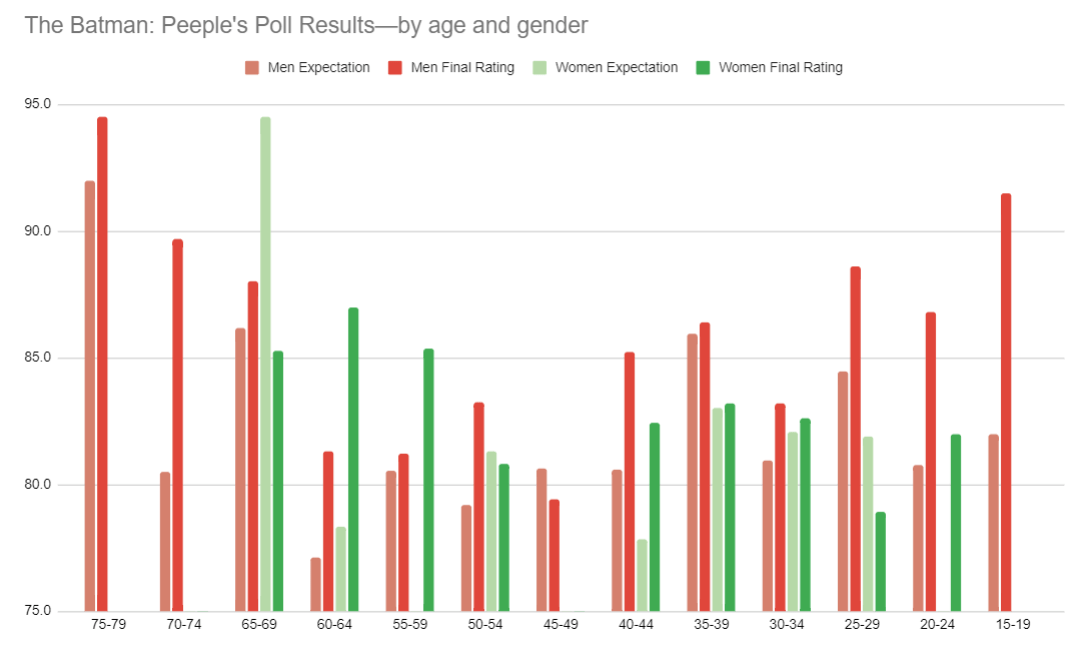
A lot of you know we have a poll in the RunPee app where we ask fans to rate a movie before they see it — using expectations — and again after they see it, to compare how it did. We think this is some pretty unique movie data and shows some interesting trends. We call this the Peeple’s Poll because — well, it should seem obvious.
The Batman vs The Peeple’s Poll
Give the chart some time. There’s a lot to break down. If it helps, the light red/green colors represent the Expectation Rating, and the darker colors represent the Final Rating. I limited the vertical axis to only the necessary range of 75-100 so that the changes would be exaggerated. If I keep a 0-100 range it obscures the subtle differences.
If you focus only on the men/red colors, then you’ll notice a distinctive u-shaped curve to the results over age. The Batman appealed to the older and younger crowd more than those in the middle. Roughly speaking, the same can be said for women, only not as pronounced.
Join the PERA (Personal Entertainment Research Assistant) waitlist.
The World's Most Indispensable Movie App
The RunPee app tells you the best times to
run & pee during a movie
so you don't miss the best scenes.
Download the RunPee app.
100% free (donation supported)
Gender only results
According to the data, women went into the theater with a lower expectation rating than men, but their final rating is nearly the same as men. By the numbers: Women had an expectation rating of 7.7, whereas men had an 8.2 expectation. The final rating was pretty close: 8.3/women to 8.4/men. The difference is that women’s final rating improved by 0.6 over expectation, whereas the men’s final rating improved 0.2 over expectation.
Gender vote counts
For whatever reason, men out voted women by a 3-to-1 margin for The Batman. Come on ladies. You need to step up and vote more often!
What people are saying
about the RunPee app.
This is a great app. I wish more people would support it
This app provides info about movies, reviews, ratings from people who have seen it before and after viewing. It has links to info about the movies. It let's you know when there will be a lull in the action and how long it will last. If you want to know what happens during that time, you can check the brief synopsis (you have to click a link, so no accidental spoilers). It has a timer you can set (silent) to alert you to a break. It also tells you whether there is anything extra during or after the credits. It's really a wonderful app. I've subscribed for a couple of years to support the developers, but I noticed some of the links to provide feedback didn't seem to work today. They also made it free, with voluntary donations to see the pee-times. If you haven't tried it, I encourage you to do so, and subscribe if you like it. I really hope the app is supported so it can continue to be maintained!
Developers note: RunPee doesn't make much money but it supports itself nicely. Donations are appreciated, but not required. We'll add as many movies to the database as we can until there are no more movie theaters.
View all reviews
Apple App Store | Google Play Store
Download RunPee app
I don’t know what the gender ratio is for the RunPee app in general, but I suspect that it’s close to 50/50, with men maybe outnumbering women by a few percent. But, what I do know: 16,419 men have submitted at least one vote to the Peeple’s Poll over the life of the RunPee app, but only 8,799 women have done so. That’s a 2-to-1 difference. I’m very curious why women seem to be more reluctant to submit their thoughts to the Peeple’s Poll.
Ratings vs Time
If you agree that true fans of Batman were more likely to see the movie sooner rather than later, then the data shows said true Batman fans had a higher expectation than maybe the casual fans, who may have wanted until Sunday to see the movie. The expectation fell from a high of 83.5 on Friday, to a low of 79.3 on Sunday. I’ll revisit this data after next weekend and see what the longer trend implies.
| day | Expectation | Final Rating | Delta |
| Friday | 83.5 | 84.8 | 1.3 |
| Saturday | 81.3 | 85.2 | 3.9 |
| Sunday | 79.3 | 82.6 | 3.3 |
| Monday | 79.7 | 82.2 | 2.5 |
More Data
Can you think of any other movie data breakdowns you would like to see? I’m good at data wrangling. 🙂
More of our articles about The Batman for you to enjoy:
Holy bladder-bursters Batman, your new film is almost 3 hours long
Is there anything extra during the end credits of The Batman?
Creator and developer of the RunPee app. When something doesn’t work right in the app it’s pretty much his fault. 🙂
Aspiring author. Would like to finish his “Zombie Revelations” trilogy if he could break away for working on RunPee and the cottage he’s building for RunPee Mom.


Good data. I can’t say why women vote less, but for me, once I get in my seat and finish fussing around with my stuff, the previews start and then I zone out until the movie begins (no phone wrangling time). Not that any of that is necessarily gender based, but that’s my excuse.
I’m watching Batman. When can I piss break please?!
The “Peetimes” are in the RunPee mobile app. You can download it for iOS or Android. Just click the buttons at the very top of the screen.
Comments are closed.