
I love movies, and I love data. So you can imagine that I love movie data a whole whole bunch. Not like love my wife love… But close. 🙂
For years I’ve been curious about movie franchises and how the individual movies are rated. I did some heavy lifting, with copious assistance from AI, and came up with the following results. (Note: I manually verified the ratings for every movie.)
First, what counts as a movie franchise? In my book, it’s any series of four or more related movies. Sorry, trilogies don’t make the cut. But there are surprisingly few of them because Hollywood loves to keep a good thing going. Honestly, Hollywood loves to keep a bad thing going, just so long as it makes even a little money.
Join the PERA (Personal Entertainment Research Assistant) waitlist.
The World's Most Indispensable Movie App
The RunPee app tells you the best times to
run & pee during a movie
so you don't miss the best scenes.


Download the RunPee app.
100% free (donation supported)
Rating Services
I’m using data from IMDb, RottenTomatoes Critics, and RottenTomatoes Audience. I would love to include the RunPee Peeple’s Poll, but we only started collecting data in 2019.
See the Interactive Franchise Graphing App
All of the tables and charts below are pulled from the data used in the Franchise Graphing App I created. Honestly, I didn’t write any of the code—I don’t write JavaScript (for the tables/charts) or Python (for the data analysis). However, I did tell AI what to write, so I claim it as my own now. 🙂
What people are saying
about the RunPee app.
November 17, 2019
One of the most useful apps I've ever come across. I've used it for years and recommended it to all my friends. Even if I'm not the type to have to pee during movies often, being able to pull up the app and pass my phone to my mom/friend/grandma so that they know when to go to the bathroom has been invaluable. Because then I don't have to summarize anything when they get back!!
View all reviews
Apple App Store | Google Play Store
Download RunPee app


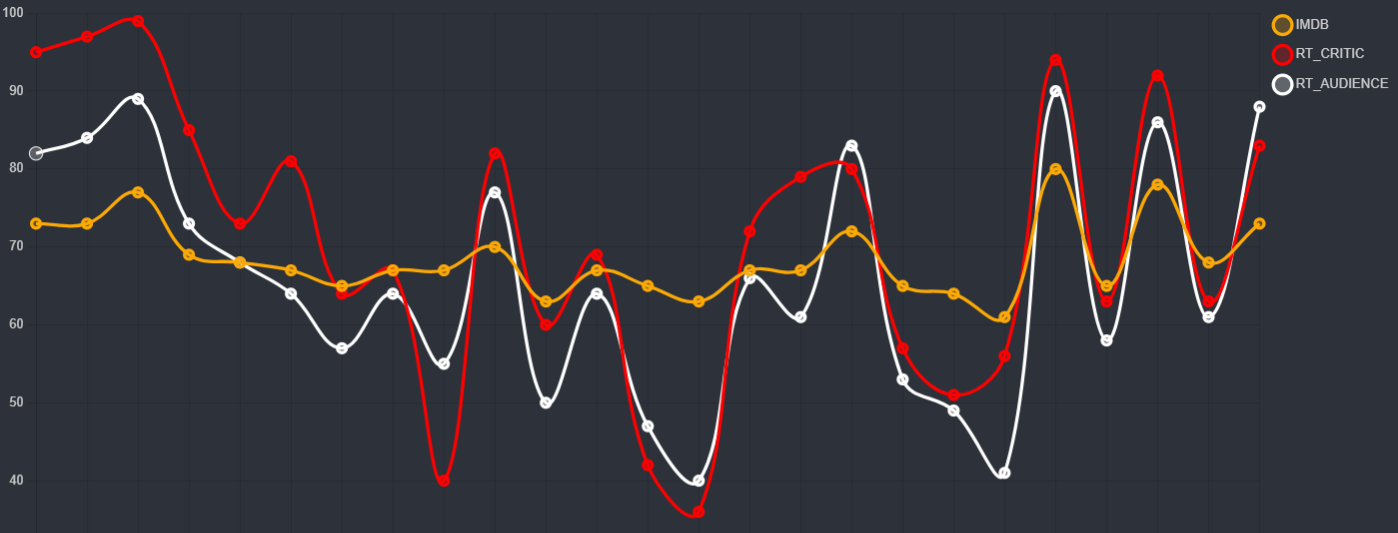
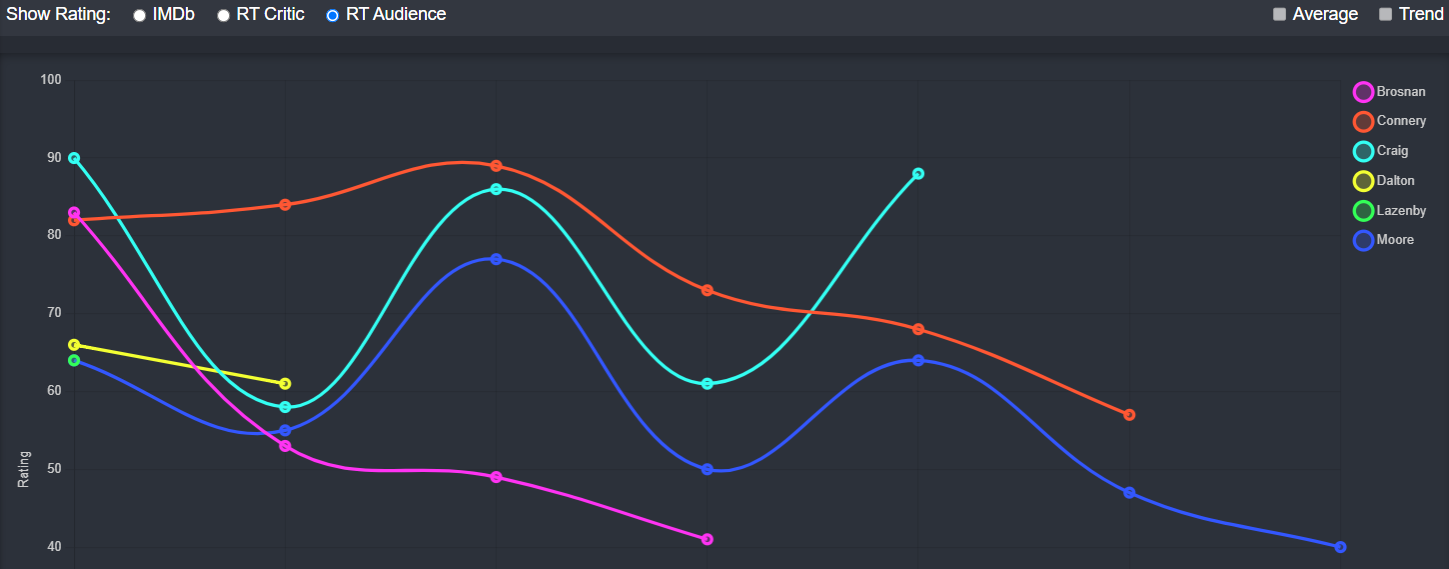
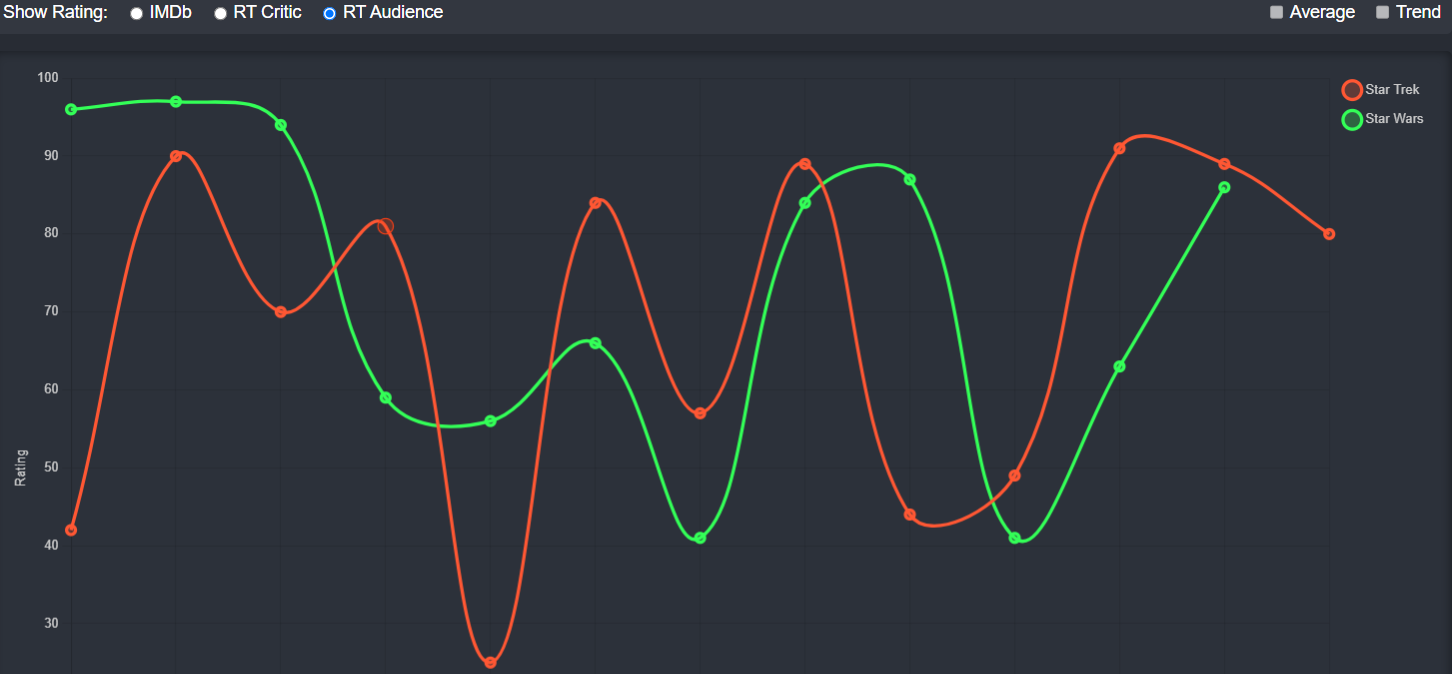
Open the Franchise Graphing App here.
Franchise Average
If we want to answer the question What is the best movie franchise ever, then is there a simpler metric than the average of its films? Probably not, but there are many other interesting analyses to consider.
| Franchise name | IMDb | RT-Critics | RT-Audience |
|---|---|---|---|
| James Bond | 6.86 | 71.2 | 66 |
| Marvel Cinematic Universe | 7.22 | 80.91 | 83.76 |
| Harry Potter | 7.4 | 75.55 | 80 |
| Mission Impossible | 7.19 | 81.86 | 75.29 |
| The Matrix | 7.1 | 68.2 | 71.6 |
| Riddick | 6.62 | 53 | 63 |
| Star Wars | 7.33 | 72.83 | 72.5 |
| Star Trek | 6.95 | 69.38 | 68.54 |
| Spider-Man | 7.21 | 75 | 75.25 |
| X-Men | 7.05 | 67.23 | 75.69 |
| Jurassic Park | 6.55 | 56.83 | 63.83 |
| Fast & Furious | 6.43 | 58.18 | 75.91 |
| Batman | 6.96 | 60.42 | 70.92 |
| Superman | 6.28 | 53.89 | 62 |
| Transformers | 6.4 | 48.67 | 71.22 |
| Pirates of the Caribbean | 7.14 | 47.4 | 68.8 |
| Lord of the Rings | 8.28 | 79.67 | 86.33 |
| Toy Story | 7.64 | 93.8 | 89.4 |
| Planet of the Apes | 6.81 | 70 | 64.56 |
| Alien | 6.7 | 59.67 | 61.11 |
| Predator | 6.17 | 47.57 | 51.14 |
| Terminator | 7 | 65 | 69.5 |
| Rocky / Creed | 7 | 71.56 | 75 |
| Mad Max | 7.24 | 90 | 75.8 |
| Lethal Weapon | 7.05 | 68.5 | 72.25 |
| Psycho | 6.45 | 55.5 | 47.83 |
| Evil Dead | 7.32 | 81.33 | 82.5 |
| Ice Age | 6.28 | 44.17 | 57.67 |
| Halloween | 5.56 | 39.77 | 52.31 |
| Scream | 6.38 | 69 | 67.5 |
| Indiana Jones | 7.36 | 80.4 | 82.4 |
| Bourne | 7.34 | 73.8 | 77.4 |
IMDb Average Analysis
The first thing that jumps out at me is the IMDb ratings jump from #1 (Lord of the Rings) to #2 (Toy Story). There’s a 0.64 point difference between them. You have to go down another 14 movies to match that difference.
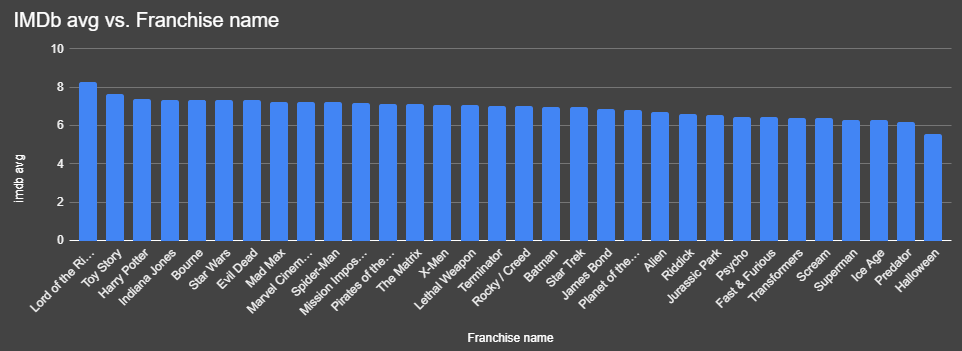
And then all the way at the bottom is Halloween. In fact, Halloween is at the bottom of the barrel for both IMDb and RT-Critics, and is third from the bottom according to RT-Audience. That’s some pretty consistent suckage there. 🙂
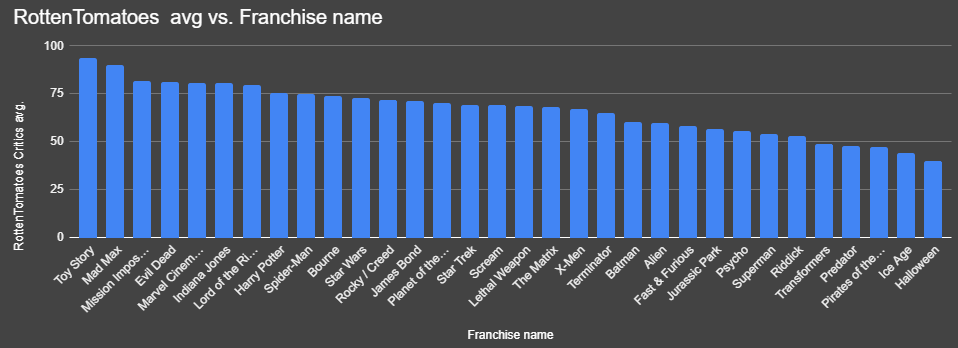
RottenTomatoes Critics Average Analysis
According to RT-Critics there is Toy Story, Mad Max, and everything else. And lordy me, but look at Evil Dead topping out above the likes of the MCU, LOTR, Spider-Man, etc. I’m not saying Evil Dead is bad. I’ve really enjoyed many of the movies in the franchise. But puuuu-lease. Better than LOTR? Really? I call bullshit. 🙂
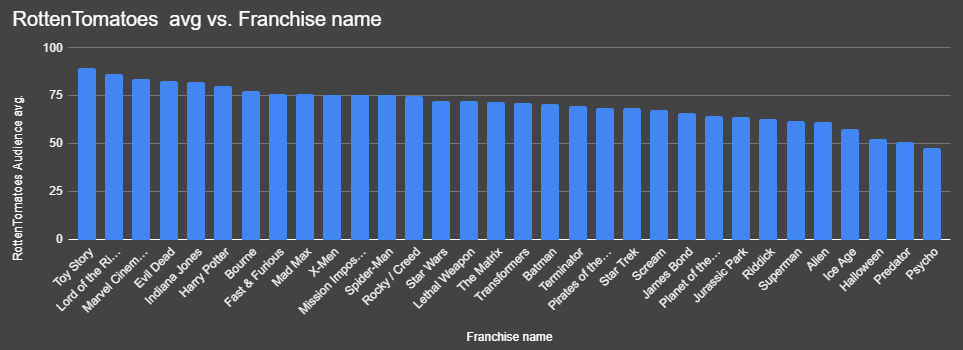
RottenTomatoes Audience Average Analysis
Now this is a little more like it: Toy Story, LOTR, MCU, Evil Dead. With Psycho showing up at the bottom of the trash pile.
Franchise Trendlines
Another interesting angle to analyse is the trendline for each franchise. There are 32 franchises in my dataset. Of those, only 7 (IMDb), 11 (RT-Critics), and 12 (RT-Audience) have a positive trendline. Basically, about 2/3s of all franchises get worse over time. But is that really surprising? Consider that many franchises became such because the first movie was a hit—I’m looking at you, The Matrix. There’s often no place but down after that. And if we want to get really picky, there are only 5 franchises that have a positive trendline in all three ratings systems: Mission Impossible, Star Trek, Spider-Man, Planet of the Apes, and Mad-Max.
Conversely, 17 franchises have a negative trendline in all three rating systems: James Bond, Harry Potter, The Matrix, Star Wars, X-Men, Jurassic Park, Pirates of the Caribbean, Lord of the Rings, Toy Story, Alien, Terminator, Lethal Weapon, Psycho, Ice Age, Halloween, Indiana Jones, and Bourne.
Notice that Toy Story is one of the highest-rated franchises, yet it has a negative trendline.
| Franchise | IMDb | RT-Critics | RT-Audience |
|---|---|---|---|
| James Bond | -0.02 | -0.60 | -0.28 |
| Marvel Cinematic Universe | -0.20 | -0.32 | 0.22 |
| Harry Potter | -1.12 | -3.55 | -1.00 |
| Mission Impossible | 1.75 | 7.25 | 6.39 |
| The Matrix | -6.80 | -9.50 | -6.20 |
| Riddick | -1.70 | -4.20 | -5.20 |
| Star Wars | -1.45 | -1.61 | -2.06 |
| Star Trek | 0.46 | 1.12 | 1.40 |
| Spider-Man | 0.96 | 3.48 | 5.48 |
| X-Men | -0.67 | -2.06 | -0.55 |
| Jurassic Park | -3.86 | -8.71 | -1.17 |
| Fast & Furious | -0.65 | 2.41 | 2.22 |
| Batman | 0.68 | -0.39 | 1.94 |
| Superman | 1.00 | -2.88 | 2.27 |
| Transformers | -0.22 | 3.58 | 1.30 |
| Pirates of the Caribbean | -4.00 | -11.90 | -7.00 |
| Lord of the Rings | -3.34 | -7.37 | -3.94 |
| Toy Story | -4.70 | -5.50 | -0.90 |
| Planet of the Apes | 0.65 | 3.48 | 3.25 |
| Alien | -3.03 | -5.57 | -3.77 |
| Predator | -1.21 | 3.29 | -1.79 |
| Terminator | -4.63 | -10.91 | -4.49 |
| Rocky / Creed | -0.73 | 2.03 | 2.08 |
| Mad Max | 1.90 | 0.60 | 3.60 |
| Lethal Weapon | -3.60 | -10.60 | -8.30 |
| Psycho | -2.31 | -9.97 | -11.51 |
| Evil Dead | -0.94 | 0.51 | -1.29 |
| Ice Age | -5.63 | -12.83 | -9.54 |
| Halloween | -0.97 | -1.14 | -0.03 |
| Scream | -1.29 | 0.11 | 3.80 |
| Indiana Jones | -5.10 | -4.80 | -4.70 |
| Bourne | -3.50 | -8.40 | -10.80 |
Franchise Standard Deviation
Another way to judge franchises against each other is by the standard deviation of the ratings from one instalment to the next.
| Franchise Name | IMDb Std Dev | RT Critic Std Dev | RT Audience Std Dev |
|---|---|---|---|
| James Bond | 0.48 | 17.76 | 15.15 |
| Marvel Cinematic Universe | 0.69 | 12.79 | 10.26 |
| Harry Potter | 0.55 | 17.52 | 9.08 |
| Mission Impossible | 0.51 | 16.30 | 16.10 |
| The Matrix | 1.00 | 19.55 | 9.26 |
| Riddick | 0.23 | 14.85 | 9.08 |
| Star Wars | 0.89 | 21.93 | 19.81 |
| Star Trek | 0.67 | 22.16 | 21.57 |
| Spider-Man | 0.56 | 17.69 | 15.47 |
| X-Men | 0.84 | 23.45 | 13.25 |
| Jurassic Park | 0.85 | 19.77 | 19.25 |
| Fast & Furious | 0.61 | 16.51 | 10.53 |
| Batman | 1.42 | 28.03 | 24.16 |
| Superman | 1.21 | 26.81 | 24.74 |
| Transformers | 0.75 | 27.38 | 19.01 |
| Pirates of the Caribbean | 0.58 | 17.83 | 11.07 |
| Lord of the Rings | 0.63 | 14.70 | 7.25 |
| Toy Story | 0.81 | 9.97 | 3.56 |
| Planet of the Apes | 0.85 | 21.92 | 21.51 |
| Alien | 1.17 | 27.78 | 23.55 |
| Predator | 1.00 | 29.45 | 20.07 |
| Terminator | 0.97 | 27.37 | 19.65 |
| Rocky / Creed | 0.70 | 21.49 | 17.19 |
| Mad Max | 0.67 | 5.29 | 14.89 |
| Lethal Weapon | 0.42 | 12.84 | 10.21 |
| Psycho | 1.44 | 23.61 | 23.79 |
| Evil Dead | 0.67 | 12.24 | 10.05 |
| Ice Age | 1.04 | 22.43 | 16.81 |
| Halloween | 0.95 | 25.23 | 17.56 |
| Scream | 0.51 | 13.47 | 17.99 |
| Indiana Jones | 0.88 | 8.11 | 15.53 |
| Bourne | 0.61 | 15.32 | 17.12 |
That’s a lot to break down, so let’s normalize the IMDb data and then average all of the standard deviations together to see which franchises are the most consistent and inconsistent.
| Franchise Name | Average Standard Deviation |
|---|---|
| James Bond | 12.56 |
| Marvel Cinematic Universe | 9.99 |
| Harry Potter | 10.69 |
| Mission Impossible | 12.49 |
| The Matrix | 12.94 |
| Riddick | 8.74 |
| Star Wars | 16.90 |
| Star Trek | 16.82 |
| Spider-Man | 12.90 |
| X-Men | 15.04 |
| Jurassic Park | 15.85 |
| Fast & Furious | 11.06 |
| Batman | 22.15 |
| Superman | 21.23 |
| Transformers | 17.97 |
| Pirates of the Caribbean | 11.57 |
| Lord of the Rings | 9.43 |
| Toy Story | 7.22 |
| Planet of the Apes | 17.29 |
| Alien | 20.99 |
| Predator | 19.85 |
| Terminator | 18.91 |
| Rocky / Creed | 15.22 |
| Mad Max | 8.94 |
| Lethal Weapon | 9.07 |
| Psycho | 20.59 |
| Evil Dead | 9.65 |
| Ice Age | 16.54 |
| Halloween | 17.41 |
| Scream | 12.18 |
| Indiana Jones | 10.82 |
| Bourne | 12.85 |
RottenTomatoes Critic and Audience agreement/disagreement
It may take a moment to get your head around this table. What we’re looking at here is the average difference between the RottenTomatoes Critics rating vs the Audience rating. A positive value means that the critics rated the movies in a franchise higher than the audience. That gives us Mad Max, Pyscho, and Mission Impossible with large positive values because the critics generally rated the movies higher than the audience.
If you want to see the franchises that were in agreement then you would look toward the middle of the table where the numbers are the smallest, franchises like Star Wars and Spider-Man.
A large negative value means that the audience rated the movies higher than the critics. So it’s no shocker to see franchises like Fast & Furious, Pirates of the Caribbean, and Transformers with large negative values.
| Franchise | Trend Value |
|---|---|
| James Bond | 5.20 |
| Marvel Cinematic Universe | -2.85 |
| Harry Potter | -4.45 |
| Mission Impossible | 6.57 |
| The Matrix | -3.40 |
| Riddick | -10.00 |
| Star Wars | 0.33 |
| Star Trek | 0.85 |
| Spider-Man | -0.25 |
| X-Men | -8.46 |
| Jurassic Park | -7.00 |
| Fast & Furious | -17.73 |
| Batman | -10.50 |
| Superman | -8.11 |
| Transformers | -22.56 |
| Pirates of the Caribbean | -21.40 |
| Lord of the Rings | -6.67 |
| Toy Story | 4.40 |
| Planet of the Apes | 5.44 |
| Alien | -1.44 |
| Predator | -3.57 |
| Terminator | -4.50 |
| Rocky / Creed | -3.44 |
| Mad Max | 14.20 |
| Lethal Weapon | -3.75 |
| Psycho | 7.67 |
| Evil Dead | -1.17 |
| Ice Age | -13.50 |
| Halloween | -12.54 |
| Scream | 1.50 |
| Indiana Jones | -2.00 |
| Bourne | -3.60 |
Franchise Runtime
You know, something that really matters in a franchise is just how much of it there is. It’s amazing that both the total runtime (MCU) and average runtime (LOTR) views have such outliers at the top.
Here’s the same data in a table.
| Franchise Name | total runtime | avg. runtime |
|---|---|---|
| James Bond | 3215 | 128.6 |
| Marvel Cinematic Universe | 4351 | 131.85 |
| Harry Potter | 1586 | 144.18 |
| Mission Impossible | 933 | 133.29 |
| The Matrix | 642 | 128.4 |
| Riddick | 382 | 95.5 |
| Star Wars | 1588 | 132.33 |
| Star Trek | 1515 | 116.54 |
| Spider-Man | 1075 | 134.38 |
| X-Men | 1553 | 119.46 |
| Jurassic Park | 746 | 124.33 |
| Fast & Furious | 1378 | 125.27 |
| Batman | 1766 | 147.17 |
| Superman | 1295 | 143.89 |
| Transformers | 1196 | 132.89 |
| Pirates of the Caribbean | 728 | 145.6 |
| Lord of the Rings | 1032 | 172.0 |
| Toy Story | 476 | 95.2 |
| Planet of the Apes | 999 | 111.0 |
| Alien | 1037 | 115.22 |
| Predator | 724 | 103.43 |
| Terminator | 715 | 119.17 |
| Rocky / Creed | 1012 | 112.44 |
| Mad Max | 563 | 112.6 |
| Lethal Weapon | 468 | 117.0 |
| Psycho | 609 | 101.5 |
| Evil Dead | 529 | 88.17 |
| Ice Age | 530 | 88.33 |
| Halloween | 1268 | 97.54 |
| Scream | 695 | 115.83 |
| Indiana Jones | 636 | 127.2 |
| Bourne | 600 | 120.0 |
Conclusion
I realize, we’ve gotten to the end and I haven’t answered the question: What is the best movie franchise of all time? I hope there’s enough data here for you to make your own decision about what you think it is. And please share your thoughts in the comments below.
For myself, I would probably trend toward the MCU as the greatest franchise, with Mission Impossible coming in close on its heels. But that could change tomorrow.
Download Data/Code To play with
If you’re interested, you can download all of the data and Python code here to play around with yourself. If you come up with something interesting then please share. I’ll try to keep the data updated as new movies are added to these franchises. Already, I know that I’ll need to add the Wick franchise after Ballerina comes out, plus there’s a new Mission Impossible and Superman movie later this summer that will need to be added. In general, I’ll add movies about a month or so after release so that their rating numbers can settle down to a constant.
Creator and developer of the RunPee app. When something doesn’t work right in the app it’s pretty much his fault. 🙂
Aspiring author. Would like to finish his “Zombie Revelations” trilogy if he could break away for working on RunPee and the cottage he’s building for RunPee Mom.