
Breakdown of Movie Grades from the RunPee Peeps

It sure doesn't seem like this past year was a good year for movies, but the numbers don't lie. The single most common grade we Peeps gave to a movie in 2023 was an A, with 26. The second most common was a B, with 17.
Grades given by Peeps
| Grade | Count |
| A++ | 2 |
| A+ | 9 |
| A | 26 |
| A- | 10 |
| B+ | 4 |
| B | 17 |
| B- | 12 |
| C+ | 7 |
| C | 5 |
| C- | 8 |
| D+ | 4 |
| D | 6 |
| D- | 2 |
There were 45 movies with an A- or better grade. Here's the full breakdown.
| Grade | Count |
| A- to A+ | 45 |
| B- to B+ | 33 |
| C- to C+ | 20 |
| D- to D+ | 12 |
I thought I was being overly critical of movies this year. I'll try harder in 2024. :-)
Here's a breakdown of movie grades by individual Peep.
Dan
| Grade | Count (57 total movies) |
| A++ | 1 |
| A+ | 3 |
| A | 7 |
| A- | 4 |
| B+ | 1 |
| B | 9 |
| B- | 6 |
| C+ | 6 |
| C | 4 |
| C- | 7 |
| D+ | 1 |
| D | 6 |
| D- | 2 |
Ohhhhh, I'm starting to understand what's going on. It must be my sister who gave away so many high grades.
| Grade | Count (41 total movies) |
| A++ | 0 |
| A+ | 4 |
| A | 14 |
| A- | 3 |
| B+ | 3 |
| B | 6 |
| B- | 6 |
| C+ | 0 |
| C | 1 |
| C- | 1 |
| D+ | 3 |
| D | 0 |
| D- | 0 |
Nearly half of the movies that RunPee Sis saw in 2023 got an A- or better grade. (21 with an A- or better and 23 for all other grades.) She's such a pushover. :-)
There were only 11 other movies added by anyone other than my sister or me; all but one of those movies got an A- grade or better.
Movie length by year
There is a popular assumption that movies are getting longer every year. Yes, it is true but not by as much as you might think. In the past 14 years, the average movie runtime has only increased by 10 minutes. In the past 10 years the average runtime has only increased by 6 minutes.
| Year | Value |
|---|---|
| 2009 | 106.5 |
| 2010 | 106.6 |
| 2011 | 106.8 |
| 2012 | 108.6 |
| 2013 | 110.5 |
| 2014 | 110.4 |
| 2015 | 111.3 |
| 2016 | 109.6 |
| 2017 | 110.2 |
| 2018 | 110.4 |
| 2022 | 116.8 |
| 2023 | 116.3 |
Movie Runtime Count by Year
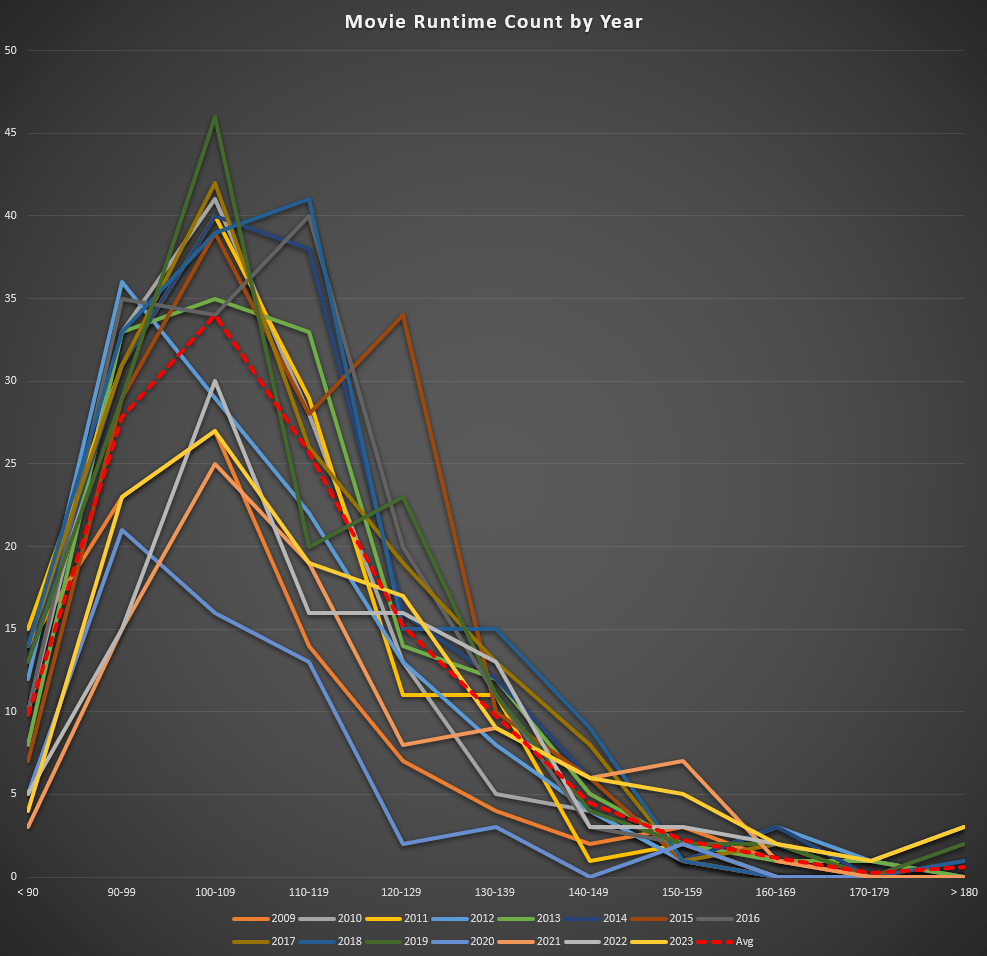
The chart above breaks down the number of movies each year with runtimes between 90-99 minutes, 100-109 minutes, and so forth.You can see from the dashed-red-line that the 100-109 range is the most common movie length. That's the case for every year except for 2012 when the most common was 90-99 minutes, and 2016 and 2018 when the 110-119 range was most common.
Number of movies each year with a runtime over 2 1/2 hours.
You can see from the data below that starting after 2020 the number of movies each year with a runtime over 2 ½ hours has more than doubled. Prior to 2020 there are 33 movies with a runtime over 2 ½ hours, for an average of 3/year. After 2020 there have been an average of 7 movies a year with a 2 ½+ runtime. That's probably what makes it seem like movies are getting longer. However, there's more to it than just that. Seven movies alone are not going to increase the average runtime for movies in a year all that much.
| Year | Value |
|---|---|
| 2009 | 4 |
| 2010 | 1 |
| 2011 | 2 |
| 2012 | 5 |
| 2013 | 4 |
| 2014 | 4 |
| 2015 | 1 |
| 2016 | 2 |
| 2017 | 3 |
| 2018 | 2 |
| 2019 | 6 |
| 2020 | 2 |
| 2021 | 8 |
| 2022 | 7 |
| 2023 | 9 |
Comments
No comments yet — be the first.